Scrap Yard Analytics Software, real-time
Scrap yard analytics software with real-time KPI dashboards, margin per material and supplier, anomaly detection on every ticket, and a 14-day forecast trained on your own data. Stop guessing - run the yard on the numbers.
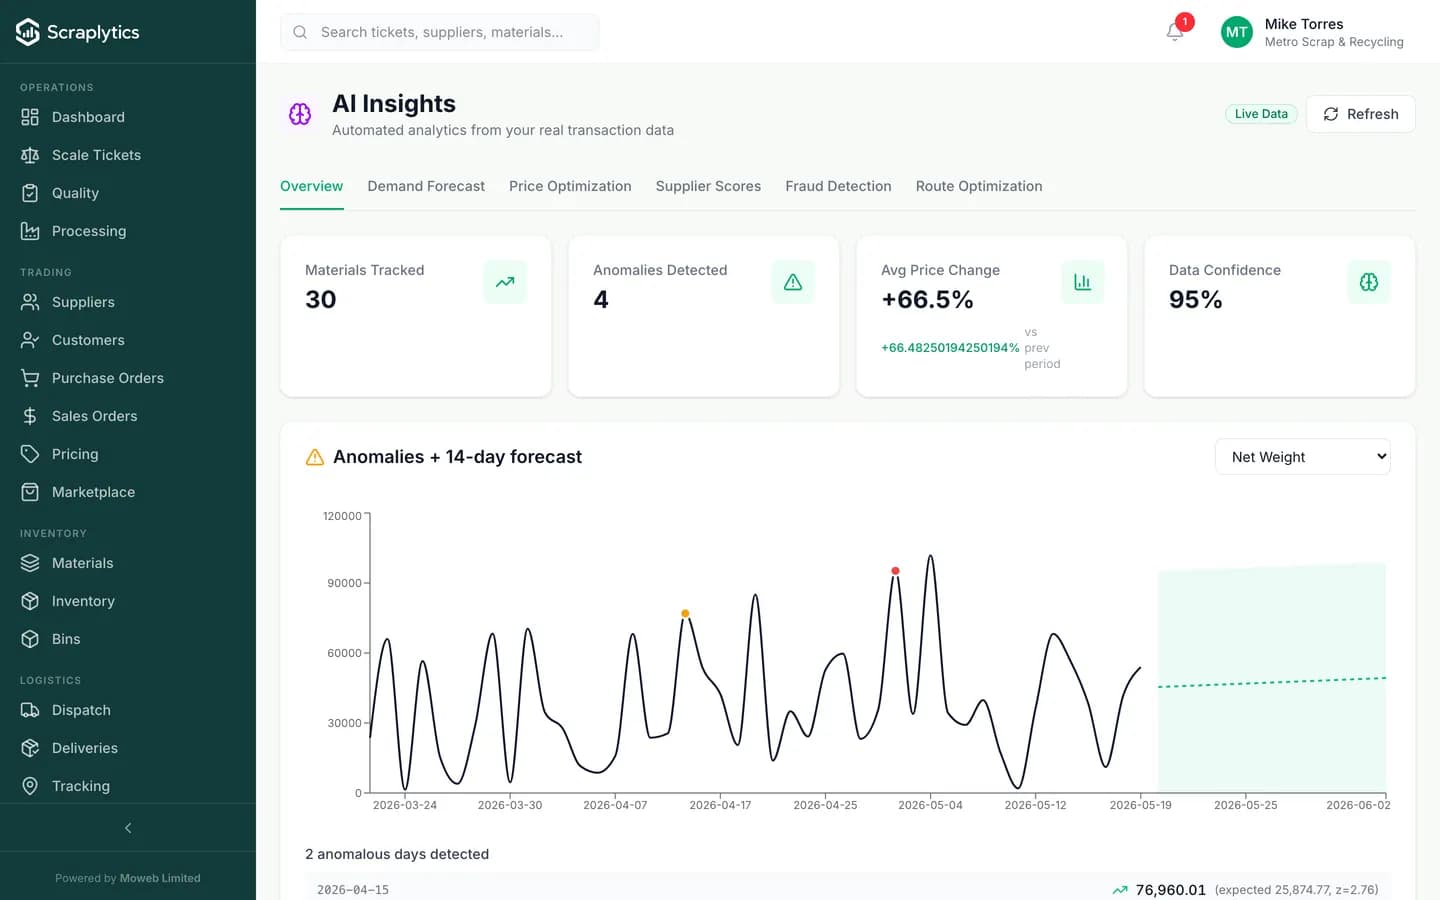
Anomalies + 14-day forecast on live transaction data.
Why owners run their yards on analytics software
Scrap yards generate enormous amounts of data and almost never use it. The dashboards turn that data into the four or five numbers you should be looking at every morning.
You run the yard from gut feel. Margins fluctuate, but you do not know which material, which supplier or which day is the cause. By the time the accountant's month-end report lands, the moment to act has passed.
Real-time dashboards show margin per material, per supplier and per day. Spot a margin collapse on tomorrow morning's coffee, not next month's board meeting.
Suppliers say "your price is too low." You have no way to argue back because you do not have your own price-trend data, only the spot price they just quoted you.
Price trend charts plot your actual paid prices against market benchmarks, by material and grade, over months. You walk into pricing conversations with the data on your laptop.
Anomalies happen and you find out from a customer or a downstream buyer. A truck weighed in twice, a grade was downgraded across 12 loads, contamination spiked from one supplier. You only catch it later.
The anomaly detection layer watches transaction patterns across your operation. When something is statistically off - duplicate weights, sudden grade shifts, supplier-level outliers - you get a notification, not a surprise.
Three Dashboards, Complete Visibility
Operations Dashboard
Live view of daily tickets, tonnage, active trucks, and yard utilization. See your entire operation at a glance.
Financial Dashboard
Track revenue, margins, outstanding payments, and cash flow across all materials and suppliers.
Supplier Intelligence
Rank suppliers by volume, quality, reliability, and profitability. Identify your best and worst performers.
Reporting & Export
Frequently asked questions
Are the dashboards real-time or refreshed once a day?+
Real-time. Every ticket, dispatch, payment and inventory move updates the dashboard within seconds. The 14-day forecast and anomaly model run on the latest committed data.
Can I build my own custom reports?+
Yes. The report builder lets you pick any combination of dimensions (material, supplier, customer, location, salesperson, period) and metrics (volume, revenue, margin, count, average price). Save the report, schedule it, export to PDF or Excel.
How does the forecast work and how accurate is it?+
It runs a time-series model on your last 90+ days of weight and price data, per material. Accuracy depends on volume: high-volume materials usually forecast within ±5-10% over the 14-day window. The forecast is a band, not a point, so you see the uncertainty.
Can I email reports to my owner / accountant on a schedule?+
Yes. Any saved report can be scheduled to email at a daily, weekly or monthly cadence, in PDF or Excel, to any internal user or external email. Owners often schedule a Monday morning revenue + margin summary.
Data-Driven Decisions
See your entire recycling operation in real-time. Start your free trial today.
Start Free Trial