Scrap Yard AI Software that watches the yard while you sleep
Scrap yard AI software with forecasts, anomaly detection and pattern analysis on your own data. Trained per-tenant, never pooled, surfaces the issues humans miss until next month's P&L.
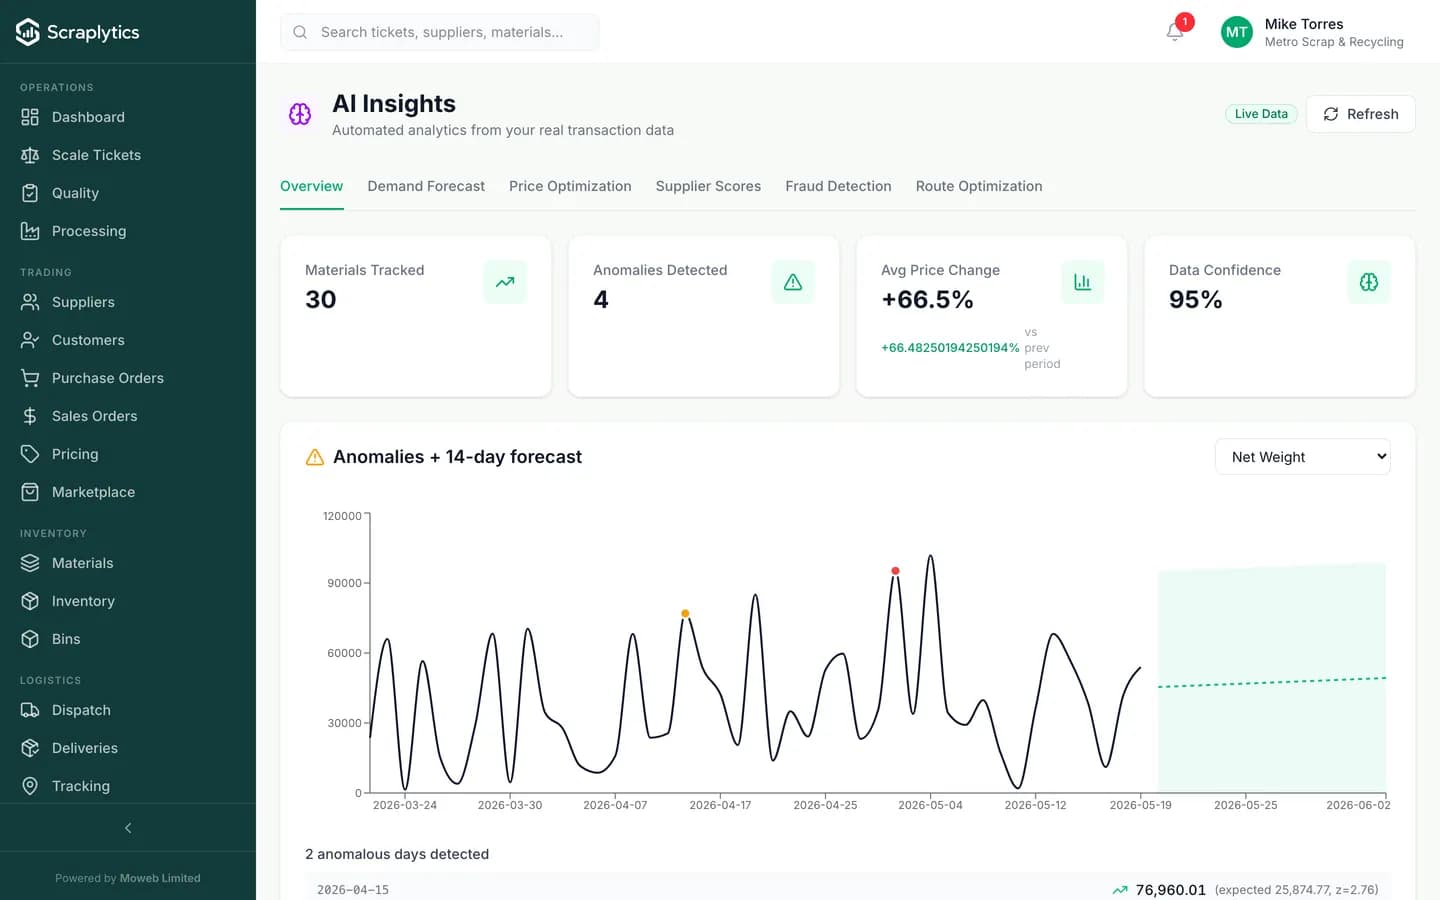
60 days of history, 14 days of forecast, anomalies flagged in real time.
Why yards turn AI software on day one
A scrap yard already generates more data than any team can read. The job is not to make more data - it is to surface the few facts that need a decision today.
By the time you spot a 12% margin slide on copper, you have already eaten two weeks of bad buys. The yard generates the data but nobody is watching it close enough.
The model watches every ticket, supplier and material continuously. A material that starts trending down 5% off its 30-day average shows up on the morning digest, not in next month's P&L.
Suppliers test the limits: same plate weighing twice in an hour, weight drifting up 3% over six months on the same material, grade quietly creeping from #1 to #2. Each is small. Together they bleed.
Anomaly detection scores every ticket against the supplier's historical pattern. Two-sigma deviations on weight, frequency, grade or value get flagged at the cashier and to the manager.
Demand is seasonal but you buy reactively. Aluminum drops, you have too much. Copper spikes, you have none. The forecast lives in your head and is wrong half the time.
The 14-day forecast band shows expected inbound weight by material. Stack it against your downstream commits and you buy ahead of the curve instead of chasing it.
Inside the AI engine
Forecasting that learns your yard, not a generic curve
The forecast model trains per-tenant on at least 30 days of your own ticket history. It captures your seasonality, your supplier cadence, your material mix. The output is a forecast band, not a single number, so you see the uncertainty. Confidence improves with data volume - by month three the band is usually tight enough to drive purchase decisions.
Anomaly detection that catches the patterns humans miss
Every ticket is scored on multiple dimensions: weight against the supplier's historical mean, frequency against their cadence, grade against the load photo, total value against the day. Two-sigma outliers fire a soft warning at the cashier. Three-sigma fires a hard hold pending manager approval. The thresholds are tunable per company.
A morning digest that fits in a coffee
Every day at the time you choose, the digest emails a one-screen summary: what changed yesterday, which materials drifted, which suppliers behaved differently, the top three anomalies. No dashboard browsing required. Owners use it as their first 90 seconds of the day to know whether anything needs attention.
What you get
Frequently asked questions
Is my data used to train a shared model that helps competitors?+
No. The forecast and anomaly models are trained per-tenant on your data only. We do not pool tenant data for model training, and your data never leaves your tenant's logical boundary.
How much history do I need before forecasts get useful?+
Useful directional forecasts kick in around 30 days. Confidence bands tighten meaningfully by day 60. By month three the model usually has enough seasonality signal to support real purchase decisions.
Can I tune the anomaly thresholds?+
Yes. Sensitivity is per-company and per-dimension (weight, frequency, grade, value). Some yards run hot (catch everything, accept false positives), others run conservative (only the obvious stuff). It is one settings screen.
What happens to a flagged ticket?+
A soft warning shows on the cashier screen with the reason. A hard hold blocks payment until a manager approves or rejects. Both outcomes are logged on the ticket, so you can review false-positive rates and tune thresholds over time.
Stop running the yard on gut
Turn the AI on with one click. Insights start arriving the morning after.
Start Free Trial